Table Explorer

Table Explorer is a powerful tool for monitoring datasets in your applications and their contents. It allows you to browse the contents of your connected metastores from the catalogs and tables to individual columns and statistics.
Table Explorer supports all four catalogs Ilum integrates with: Hive Metastore, Project Nessie (with branch switching to inspect tables on different Nessie branches), Unity Catalog, and DuckLake. The active catalog can be selected from the catalog dropdown.
Recent enhancements
- Editable table descriptions: Inspect and edit table-level descriptions directly from the metadata panel, with changes persisted through the catalog.
- Configurable preview limit: Adjust the row limit for data previews per session.
- Auto-refresh toggle: Keep the metadata view in sync with catalog changes without manual reload.
- Open in Lineage: Jump from any table directly to its lineage graph in the Ilum Lineage view.
- Nessie branch selector: Switch the active Nessie branch (for example
main,dev,staging) and re-list tables for that branch.
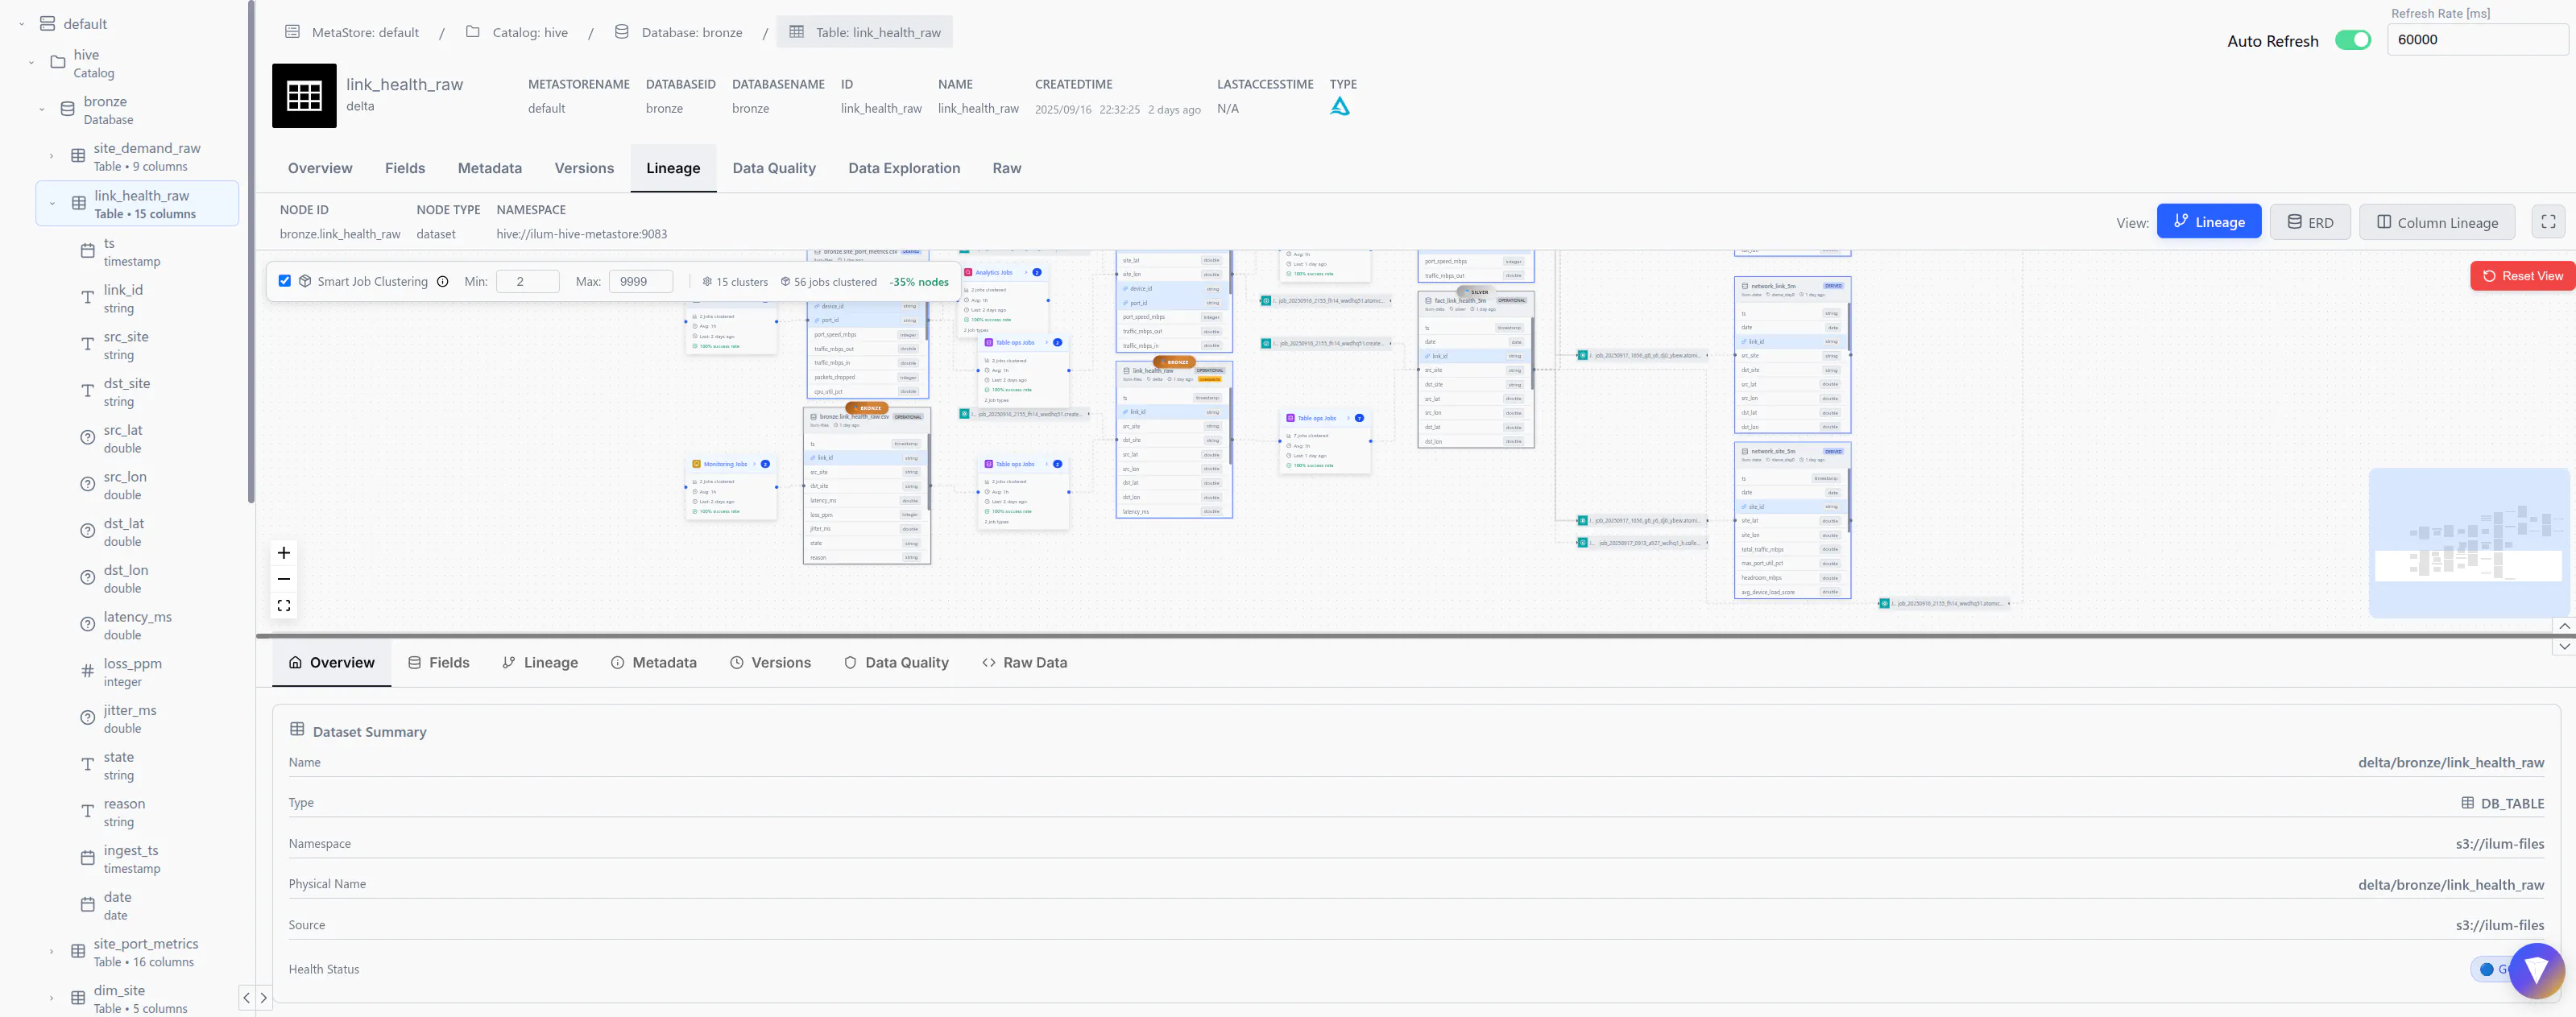 Table explorer is also able to show you the lineage of your tables similarly to the dedicated lineage tab
To learn more about lineage, please refer to the documentation of the lineage features in Ilum.
Viewing the Metadata in the Table Explorer
In order for you to see anything in the table explorer, you need to save your dataset as a table, while being connected to Ilum’s metastore.
When doing it through Ilum jobs, services, or the SQL Editor, the cluster settings should take care of it automatically.
To learn more about connecting your workloads to a metastore, refer to the data catalogs documentation.
Data Exploration Tool
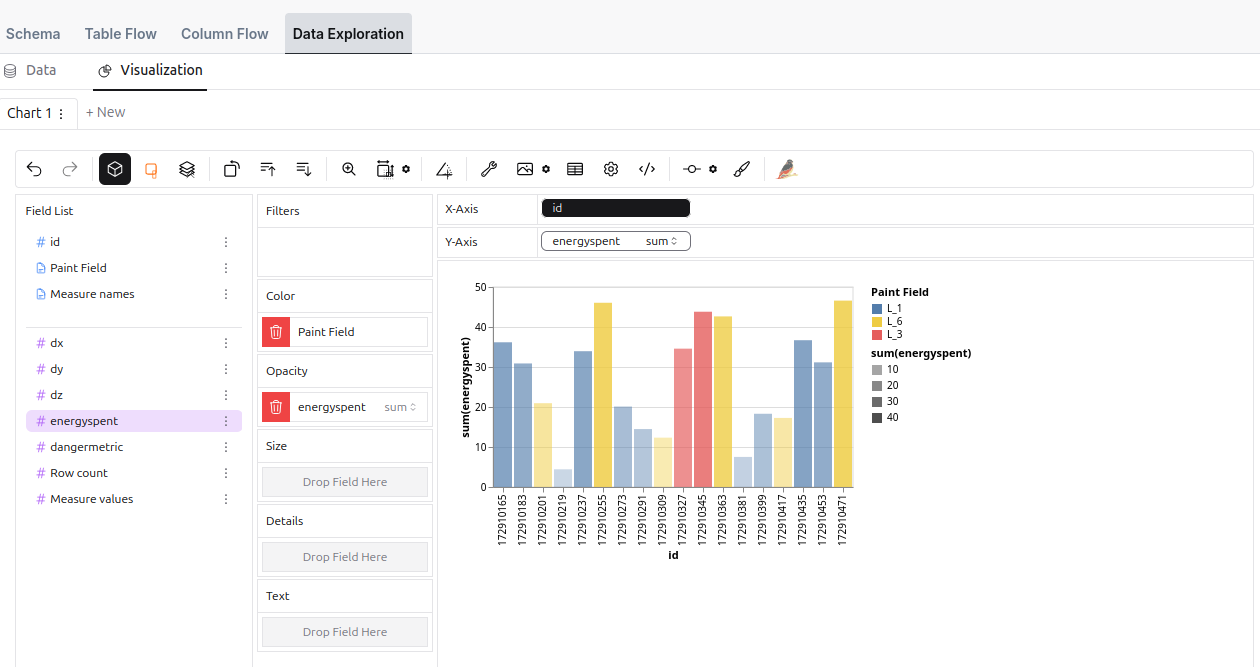
The Data Exploration Tool allows you to interactively explore and visualize a sample of your dataset through an intuitive user interface. This tool enables users to analyze data efficiently, offering a wide range of customization options for data representation and chart generation.
How it differs from more advanced BI tools is that it fetches data from the source directly. It cannot generate optimized queries, which makes it straightforward for exploratory analysis but unsuitable for larger workloads.
Even though the tool is not optimized for large datasets, it is still very capable in terms of data exploration and visualization. It offers a wide range of features, including:
- Data aggregation, grouping, and filtering
- Twelve different charts and plot types
- Exporting to CSV, SVG, and PNG
- Customization options for chart appearance and layout
And all of that, directly from your browser!
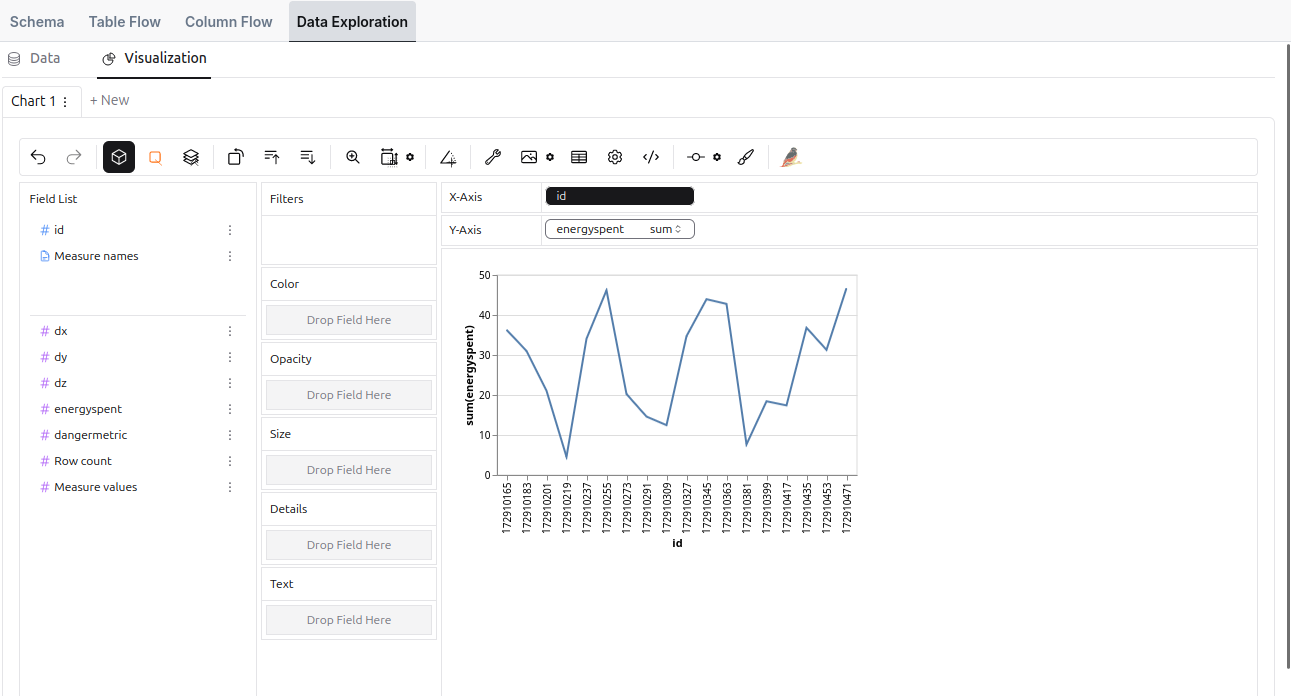 An example of a line chart
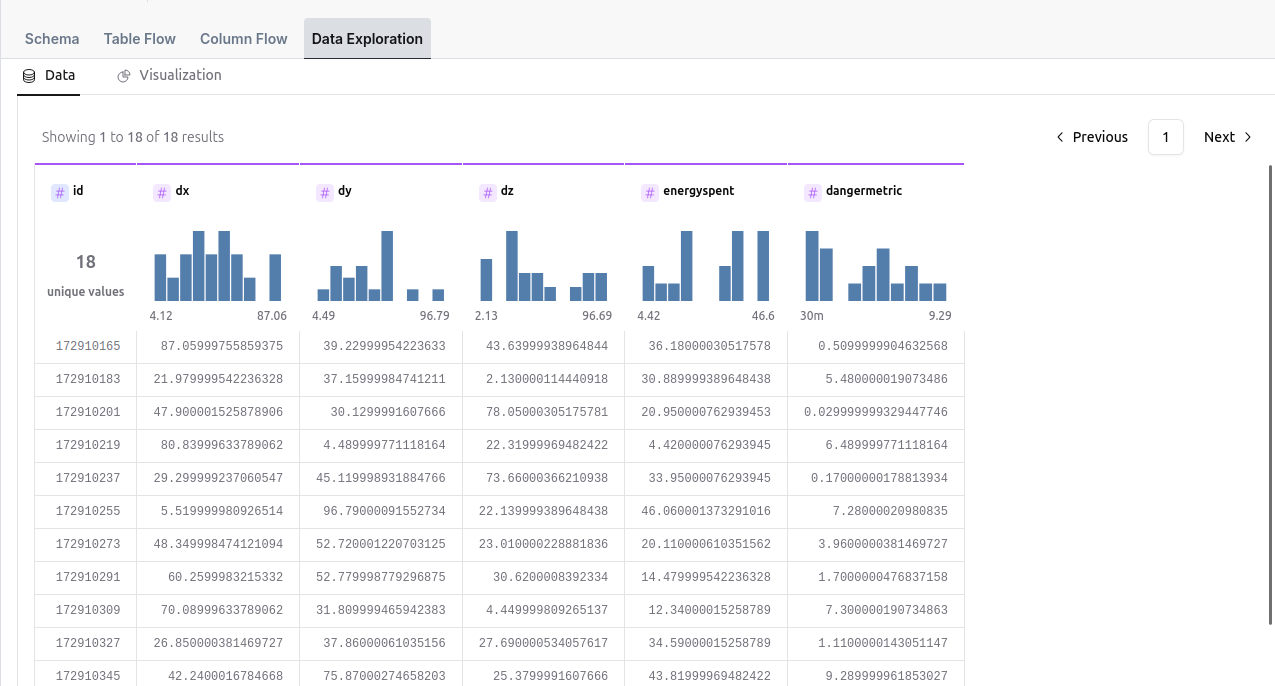 There is also a possibility of tabular data visualization