Monitoring Apache Spark on Kubernetes
Effective observability is critical for maintaining the reliability and performance of distributed data processing systems. Ilum provides a multi-layered monitoring architecture for Apache Spark on Kubernetes, integrating native real-time insights with industry-standard open-source tools.
This guide covers the three pillars of Ilum's observability stack:
- Application Metrics: Real-time job statistics, JVM performance, and executor health via Ilum UI and Prometheus.
- Infrastructure Monitoring: Cluster resource utilization (CPU/Memory) via Kubernetes metrics.
- Distributed Logging: Centralized log aggregation and query capabilities using Loki and Promtail.
Ilum Native Monitoring
Ilum's built-in monitoring interface provides immediate, high-level visibility into job execution without requiring external tool configuration. It acts as the first line of defense for detecting job failures and performance regressions.
Real-time Job Metrics
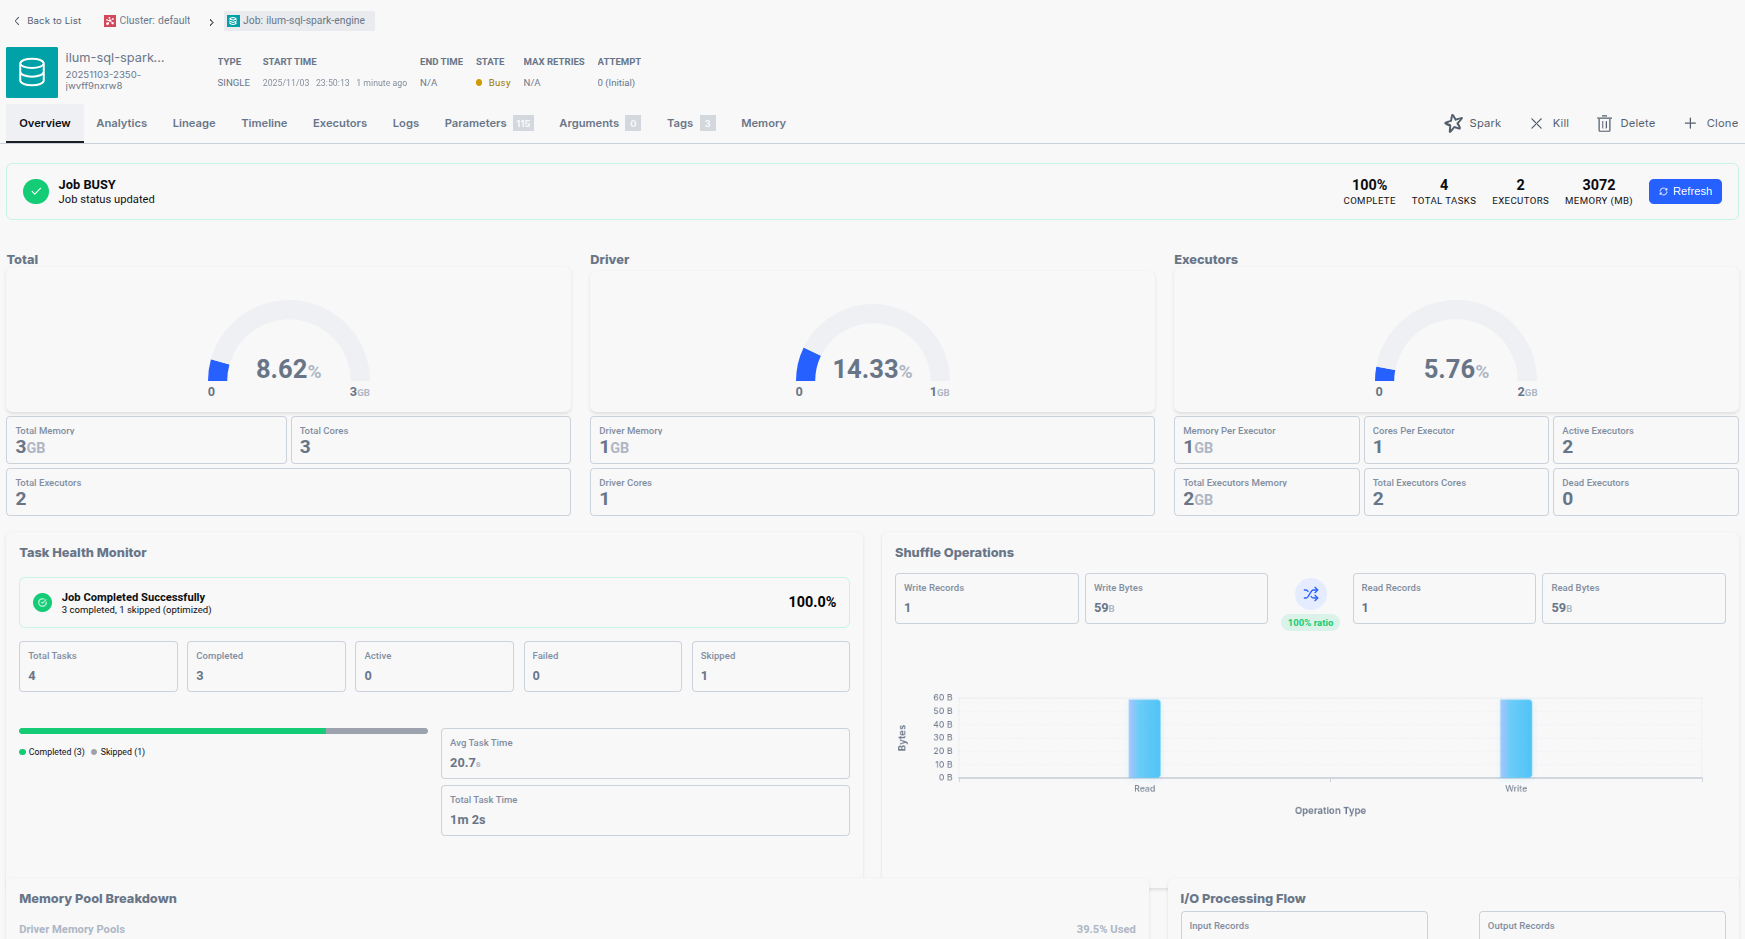
For every Spark application managed by Ilum, the UI exposes granular telemetry covering resource allocation, task throughput, and memory consumption.
Key Monitoring Dimensions:
- Resource Allocation: Tracks the count of active executors, total cores assigned, and aggregated memory usage across the cluster. This helps verify if a job is receiving the requested Kubernetes resources.
- Task Throughput: Displays the lifecycle of Spark tasks (Running, Completed, Failed, and Interrupted). A high failure rate often indicates data quality issues or transient network faults.
- Memory & Data I/O: Monitors peak Heap/Off-Heap memory usage and Shuffle I/O (input/output bytes). Sudden spikes in Shuffle Write can indicate expensive
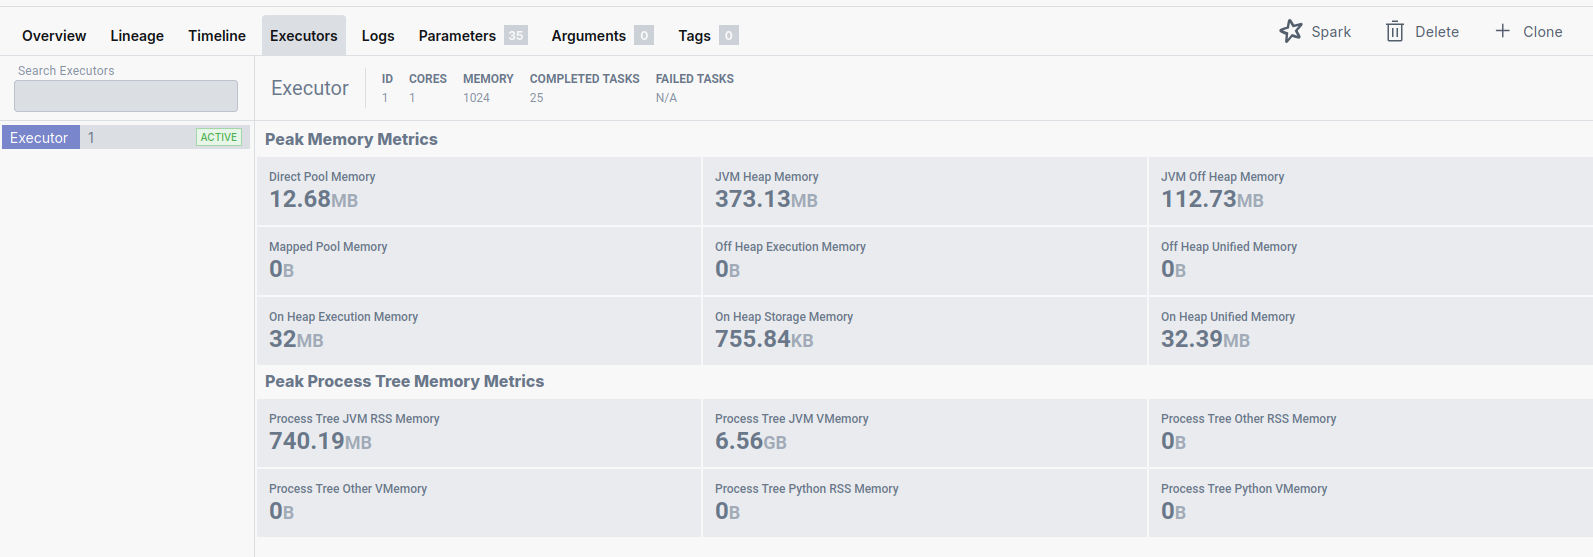
groupByorjoinoperations. - Executor Health: Detailed breakdown of memory pools (Execution vs. Storage) per executor, essential for tuning
spark.memory.fraction.
Execution Timeline Analysis
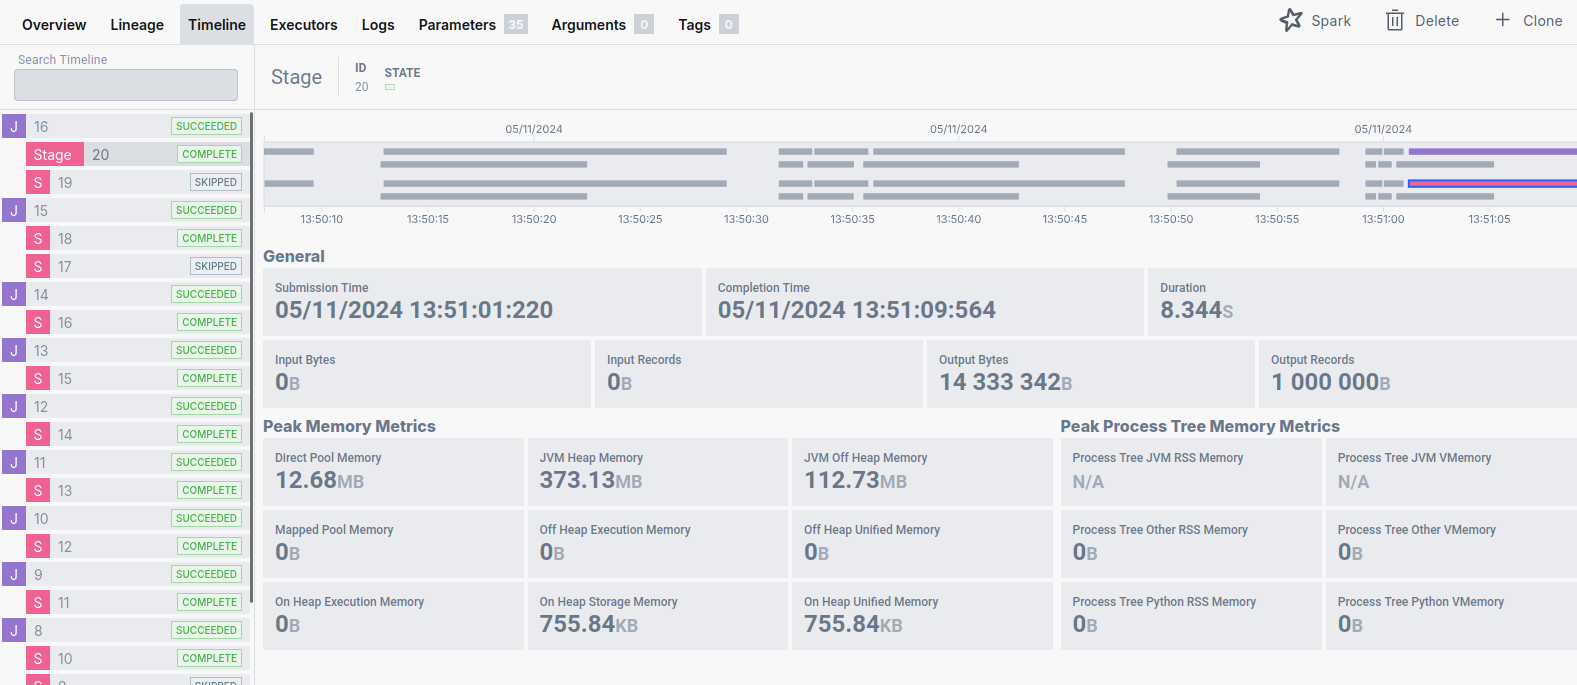
Understanding the temporal structure of a Spark application is vital for performance optimization. Ilum's Timeline module visualizes the execution flow, distinguishing between high-level Spark Jobs and their constituent Stages.
- Spark Jobs: Triggered by actions (e.g.,
count(),collect(),save()). - Stages: Boundaries created by Shuffle operations (data redistribution).
The Timeline view allows engineers to identify:
- Long-tail Stages: Stages that take disproportionately long to complete.
- Straggler Tasks: Individual tasks that delay the completion of a stage, often caused by data skew.
Cluster Resource Utilization
Ilum aggregates metrics from the underlying Kubernetes cluster to show total resource consumption. This view is crucial for capacity planning and ensuring that the cluster has sufficient headroom for pending workloads.

Apache Spark UI & History Server
While Ilum provides a consolidated view, the native Spark UI remains the standard for deep-dive DAG (Directed Acyclic Graph) analysis and SQL query planning.
Accessing the Spark UI
For running jobs, the Spark UI is proxied directly through the Ilum interface. For completed applications, Ilum bundles a Spark History Server.
Persistent Event Logging
The History Server relies on Spark Event Logs stored on a persistent volume. This integration is configured via Helm parameters:
ilum-core:
  historyServer:
    enabled: true
    # Ensures logs persist across restarts
    volume:
      enabled: true
      size: 10Gi
Note: To disable the History Server (e.g., in resource-constrained environments), run:
helm upgrade --set ilum-core.historyServer.enabled=false --reuse-values ilum ilum/ilum
You can access the History Server directly via port-forwarding:
kubectl port-forward svc/ilum-history-server 9666:18080
Advanced Monitoring with Prometheus
For production environments, Ilum integrates with the Prometheus ecosystem to scrape, store, and alert on time-series metrics. This integration uses the PrometheusServlet sink in Spark to expose metrics in a format compatible with Prometheus scraping.
Architecture & Configuration
Ilum automatically configures the PodMonitor custom resource (part of the Prometheus Operator) to discover Spark driver and executor pods.
Enabling Prometheus Integration:
The Prometheus stack is optional. Enable it via Helm:
helm upgrade \
  --set kube-prometheus-stack.enabled=true \
  --set ilum-core.job.prometheus.enabled=true \
  --reuse-values ilum ilum/ilum
This configuration injects the following Spark properties into every job:
spark.ui.prometheus.enabled=true
spark.metrics.conf.*.sink.prometheusServlet.class=org.apache.spark.metrics.sink.PrometheusServlet
spark.metrics.conf.*.sink.prometheusServlet.path=/metrics/prometheus/
spark.executor.processTreeMetrics.enabled=true
Critical Spark Metrics to Monitor
When monitoring Spark on Kubernetes, focus on these high-signal metrics:
| Metric Category | Metric Name (PromQL Pattern) | Why it matters |
|---|---|---|
| Memory | metrics_executor_heapMemoryUsed_bytes | High heap usage (>90%) correlates with frequent Full GC and OOM risks. |
| Garbage Collection | metrics_executor_jvm_G1_Young_Generation_count | Frequent GC pauses freeze execution threads, reducing throughput. |
| Shuffle I/O | metrics_shuffle_read_bytes_total | Massive shuffle reads indicate network-heavy operations (joins/grouping). |
| CPU/Tasks | metrics_executor_threadpool_activeTasks | Should match the number of allocated cores. Low utilization implies resource waste. |
Querying with PromQL
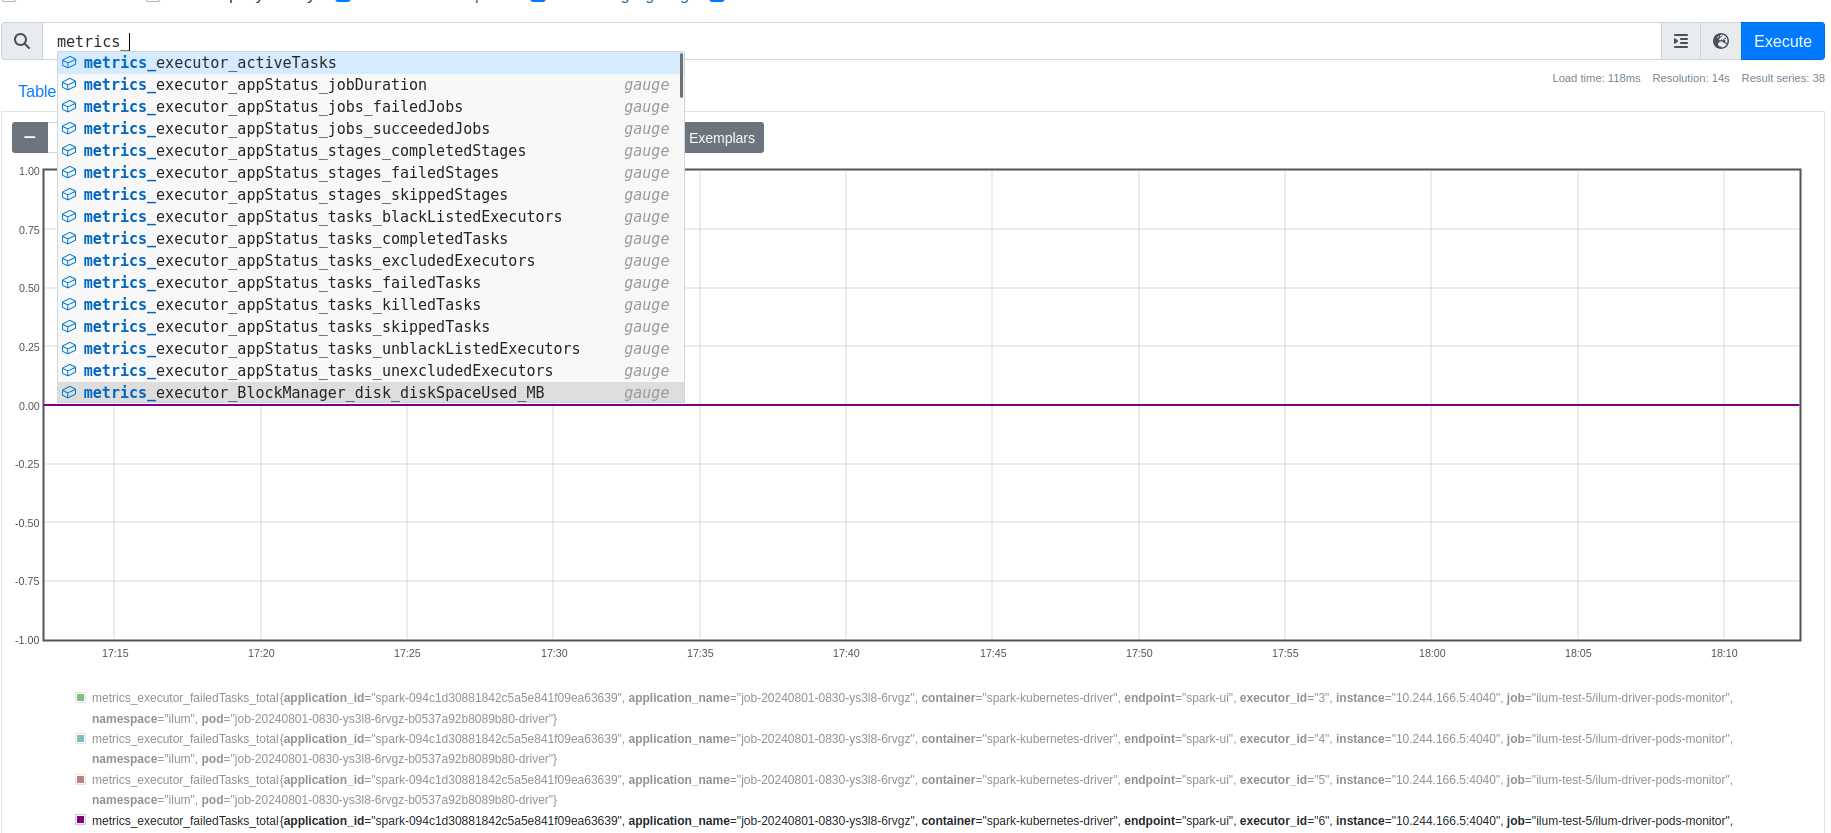
Access the Prometheus UI via port-forward:
kubectl port-forward svc/prometheus-operated 9090:9090
Example PromQL Queries:
-
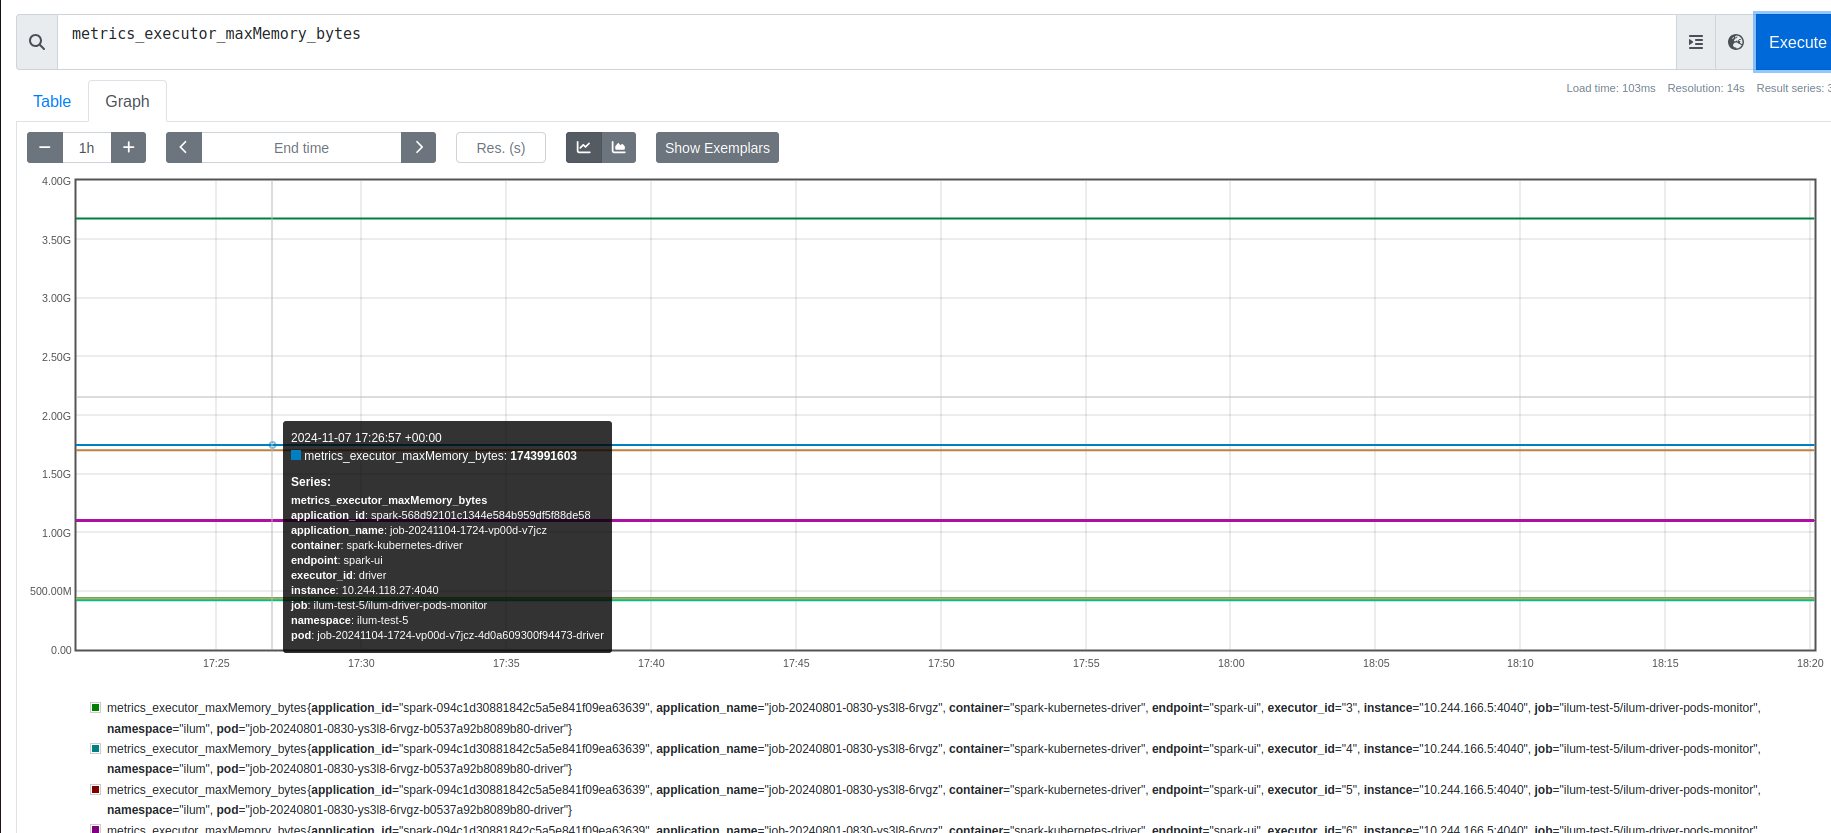
Max Memory Usage per Job:
max(metrics_executor_maxMemory_bytes{namespace="ilum"}) by (pod) -
Total Active Tasks in Cluster:
sum(metrics_executor_threadpool_activeTasks)
Zabbix Integration
Organizations using Zabbix for infrastructure monitoring can consume ilum's Prometheus metrics directly. Zabbix 4.2+ includes a native Prometheus data preprocessing capability and HTTP agent items that can scrape Prometheus endpoints without additional exporters.
Configure a Zabbix HTTP agent item pointing to the Prometheus endpoint exposed by ilum's PodMonitor, and use Prometheus pattern preprocessing to extract specific metrics.
Visualization with Grafana
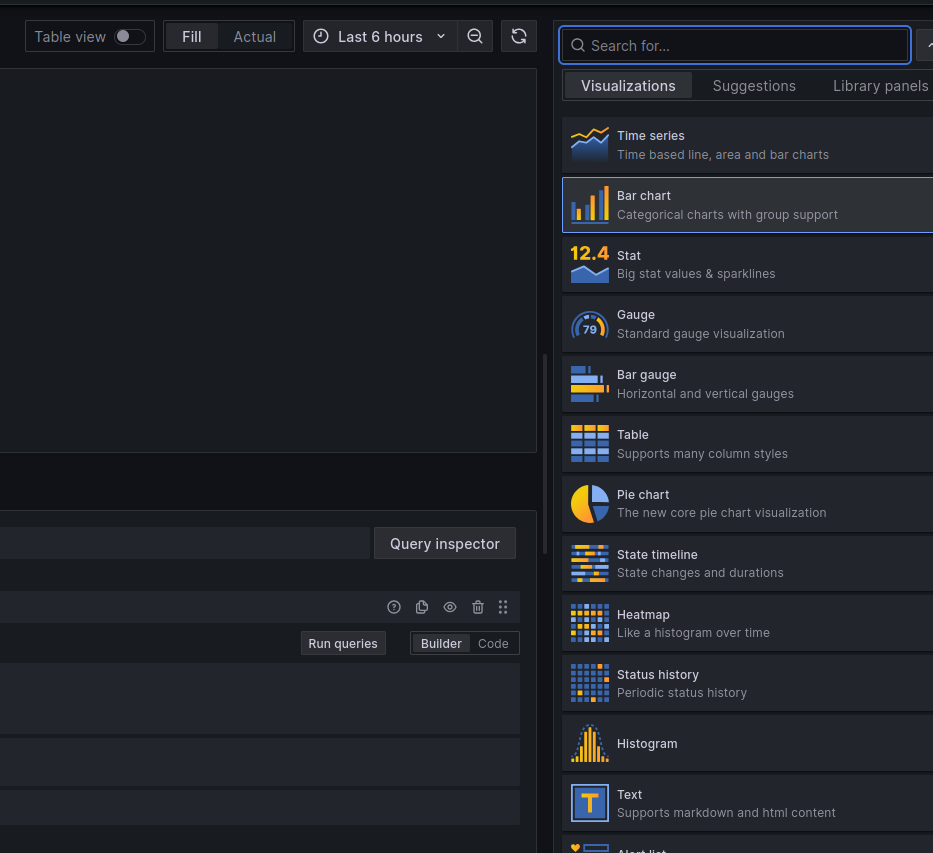
Ilum leverages Grafana for dashboarding, providing pre-built visualizations that correlate Spark metrics with Kubernetes infrastructure metrics.
Default Dashboards
Ilum ships with a suite of dashboards located in the Ilum folder:
- Ilum Spark Job Overview: High-level health check of all running jobs (Success/Failure rates, Total Cluster Memory).
- Ilum Spark Job Detail: Deep dive into a single application id. Correlates Driver vs. Executor memory usage.
- Ilum Pod Monitor: Infrastructure metrics for the Ilum control plane (CPU throttling, Memory limits).

Accessing Grafana
kubectl port-forward svc/ilum-grafana 8080:80
# Default Credentials: admin / prom-operator
Distributed Logging with Loki
Logs are the source of truth for debugging failures. Ilum integrates Loki (log aggregation) and Promtail (log shipping) to centralize logs from ephemeral Spark executors.
Log Architecture
- Promtail: Runs as a DaemonSet on every Kubernetes node, tailing stdout/stderr from containers and shipping them to Loki.
- Loki: Stores compressed logs in object storage (MinIO) and indexes metadata (labels).
- LogQL: A query language inspired by PromQL for filtering logs.
Loki natively supports OpenTelemetry-compatible log ingestion via the OTLP endpoint. If your organization standardizes on OpenTelemetry, you can replace Promtail with an OpenTelemetry Collector configured to export logs to Loki. This provides a unified telemetry pipeline for logs, metrics, and traces without changing the storage backend.
Configure the OTel Collector's Loki exporter:
exporters:
  loki:
    endpoint: http://ilum-loki:3100/loki/api/v1/push
Enable Logging Stack:
helm upgrade ilum ilum/ilum \
    --set global.logAggregation.enabled=true \
    --set global.logAggregation.loki.enabled=true \
    --set global.logAggregation.promtail.enabled=true \
    --reuse-values
Effective LogQL for Spark
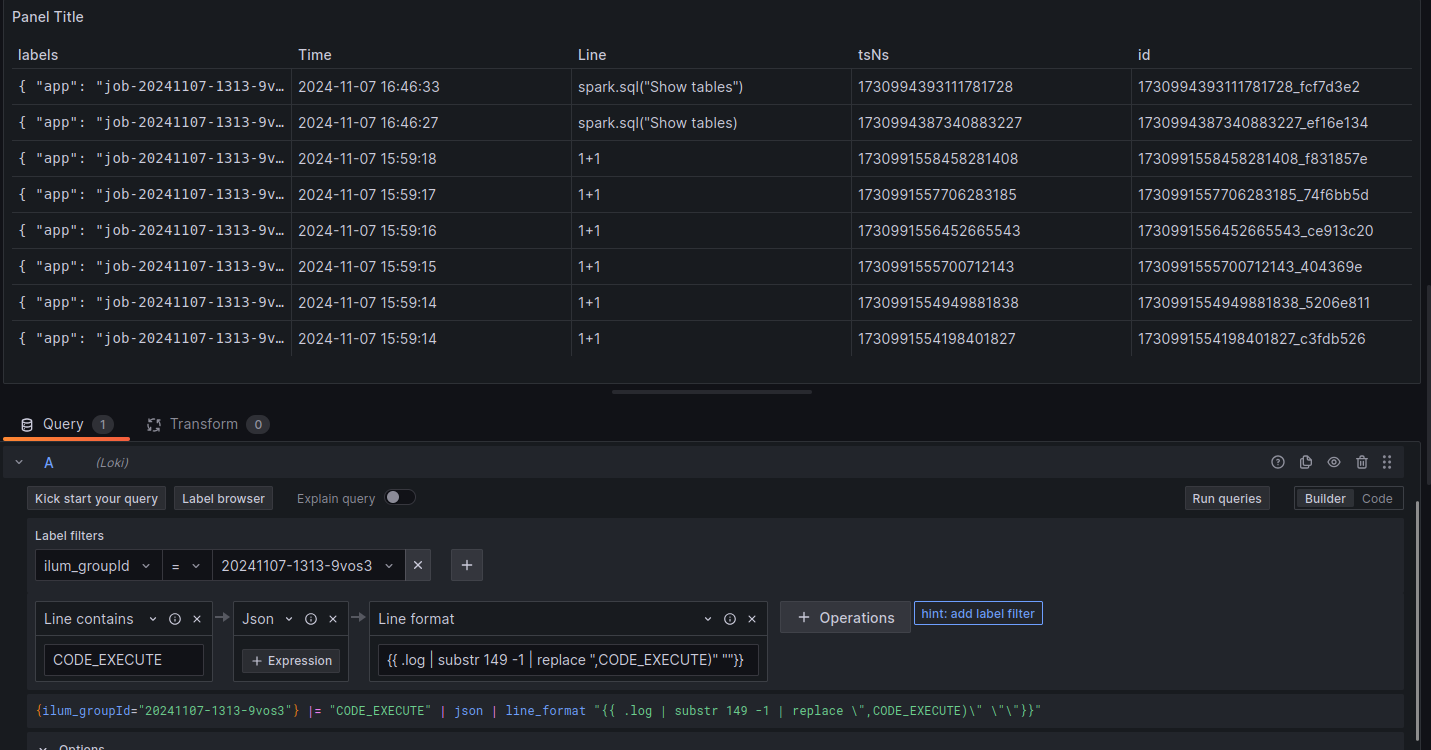
Effective debugging requires filtering noise. Use these LogQL patterns to find root causes:
-
Find specific Exception traces:
{namespace="ilum"} |= "Exception" |!= "at org.apache.spark" -
Isolate logs for a specific Spark Application:
{app="job-20241107-1313-driver"} -
Detect Container OOM Kills (System Logs):
{namespace="ilum"} |= "OOMKilled"
Integrating with Elasticsearch / OpenSearch
While ilum ships with Loki as the default log aggregation backend, organizations standardized on the Elastic Stack (ELK) or OpenSearch can integrate ilum's logs and metrics into their existing infrastructure.
Log Shipping with Fluent Bit
Replace or supplement Promtail with Fluent Bit to ship container logs to Elasticsearch:
# Fluent Bit output configuration for Elasticsearch
[OUTPUT]
    Name            es
    Match           kube.*
    Host            elasticsearch.logging.svc
    Port            9200
    Index           ilum-logs
    Type            _doc
    Logstash_Format On
    Logstash_Prefix ilum
    Suppress_Type_Name On
Alternatively, use Fluentd with the fluent-plugin-elasticsearch output plugin for more complex parsing and routing requirements.
Index Templates for Spark Metrics
Create an Elasticsearch index template optimized for Spark metrics:
{
  "index_patterns": ["ilum-spark-*"],
  "template": {
    "settings": {
      "number_of_shards": 2,
      "number_of_replicas": 1
    },
    "mappings": {
      "properties": {
        "timestamp": { "type": "date" },
        "namespace": { "type": "keyword" },
        "application_id": { "type": "keyword" },
        "executor_id": { "type": "keyword" },
        "heap_memory_used": { "type": "long" },
        "shuffle_read_bytes": { "type": "long" },
        "active_tasks": { "type": "integer" }
      }
    }
  }
}
Prometheus Remote Write to Elasticsearch
Export Prometheus metrics to Elasticsearch using the Prometheus remote write feature or a sidecar exporter, enabling correlation of time-series metrics with log data in Kibana/OpenSearch Dashboards.
Kibana Dashboard Patterns
Build Kibana dashboards for ilum observability:
- Log Explorer: Filter by
kubernetes.namespace,kubernetes.pod_name, and log level to isolate Spark driver/executor logs - Error Rate Dashboard: Visualize exception frequency across jobs using aggregations on log patterns
- Resource Heatmap: Correlate CPU/memory metrics with job execution timelines
When using Elasticsearch/OpenSearch alongside Loki, ilum's native log viewer in the UI continues to use Loki. The Elasticsearch integration provides an additional, external observability path for teams with existing ELK infrastructure.
Cost & Usage Tracking
Effective cost management in multi-tenant environments requires visibility into resource consumption at the team and project level. Ilum's integration with Prometheus and Grafana provides the foundation for tracking compute costs and attributing them to specific teams or workloads.
Namespace-Level Resource Consumption
Since ilum isolates workloads via Kubernetes namespaces, resource consumption can be tracked per namespace using built-in Kubernetes metrics:
CPU Hours per Namespace:
sum(rate(container_cpu_usage_seconds_total{namespace=~"ilum-.*"}[1h])) by (namespace)
Memory Hours per Namespace (GB-hours):
sum(avg_over_time(container_memory_working_set_bytes{namespace=~"ilum-.*"}[1h])) by (namespace) / 1024^3
Spark Job Cost Estimation
Individual Spark job costs can be estimated from executor metrics. The following PromQL query calculates total executor-seconds per application:
sum(
  count_over_time(metrics_executor_threadpool_activeTasks{namespace="ilum"}[1h])
) by (app)
Combine this with your cloud provider's per-vCPU-hour pricing to derive cost estimates.
Building a Cost Attribution Dashboard
Create a Grafana dashboard with the following panels for chargeback reporting:
| Panel | PromQL | Purpose |
|---|---|---|
| CPU Hours by Team | sum(rate(container_cpu_usage_seconds_total[24h])) by (namespace) * 24 | Daily CPU consumption per namespace |
| Memory GB-Hours by Team | sum(avg_over_time(container_memory_working_set_bytes[24h])) by (namespace) / 1024^3 * 24 | Daily memory consumption per namespace |
| Active Executors Over Time | sum(metrics_executor_threadpool_activeTasks) by (namespace) | Concurrent compute usage trend |
| Storage Usage | sum(kubelet_volume_stats_used_bytes{namespace=~"ilum-.*"}) by (namespace) | Persistent volume usage |
Cloud Billing Integration
For precise cost attribution, integrate Prometheus metrics with cloud billing APIs:
- AWS: Use Cost Explorer API with resource tags matching Kubernetes namespace labels
- GCP: Enable GKE usage metering to export per-namespace resource consumption to BigQuery
- Azure: Use Azure Cost Management with AKS cost analysis by namespace
For a turnkey solution, consider deploying OpenCost alongside ilum. OpenCost provides real-time Kubernetes cost monitoring and integrates with Prometheus and Grafana, offering per-pod and per-namespace cost breakdowns using actual cloud billing data.
Troubleshooting Guide
1. Detecting OutOfMemory (OOM) Errors
OOM errors in Spark on Kubernetes usually manifest in two ways:
- Java OOM (
java.lang.OutOfMemoryError): The JVM runs out of Heap space.- Diagnosis: Search logs for
java.lang.OutOfMemoryError: Java heap space. - Fix: Increase
spark.executor.memory.
- Diagnosis: Search logs for
- Container OOM (Exit Code 137): The OS kills the container because it exceeded the Kubernetes memory limit (Off-heap usage + Overhead).
- Diagnosis: Sudden disappearance of metrics in Grafana coupled with
Reason: OOMKilledin Kubernetes events. - Fix: Increase
spark.kubernetes.memoryOverheadFactororspark.executor.memoryOverhead.
- Diagnosis: Sudden disappearance of metrics in Grafana coupled with
2. Identifying Data Skew
Data skew occurs when one partition contains significantly more data than others, causing a single task to run much longer than the rest ("Straggler").
- Diagnosis: In the Ilum Timeline, look for a stage where the Max Task Duration is 10x+ higher than the Median Task Duration.
- Fix: Use
repartition()to redistribute data or enable Adaptive Query Execution (spark.sql.adaptive.enabled=true).
Legacy Support: Graphite
For environments already standardized on Graphite, Ilum supports pushing metrics via the GraphiteSink.
Enable Graphite Exporter:
helm upgrade ilum ilum/ilum \
    --set ilum-core.job.graphite.enabled=true \
    --set graphite-exporter.graphite.enabled=true \
    --reuse-values
